AI-Powered Storytelling & Reporting

Data speaks. We give it a voice.

Stop wasting hours stitching charts together. Let Bayeslab Agents handle the storytelling, from professional slide decks to proactive business monitoring.

Financial Analytics
December 2025|PORTFOLIO ANALYSIS

Credit Risk Analysis
& Strategic Recommendations

COMPREHENSIVE 1,000-CUSTOMER PORTFOLIO ASSESSMENT

01 // Core Value Pillars

The Big Four

A complete workflow from narrative generation to live decision support, built for teams that need speed, credibility, and consistency.

CORE VALUE PILLAR 1

Consultant-Grade Automation

  • Professionalism at the speed of thought.

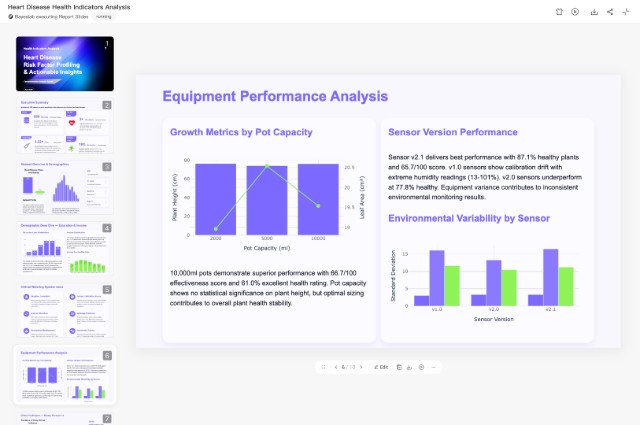
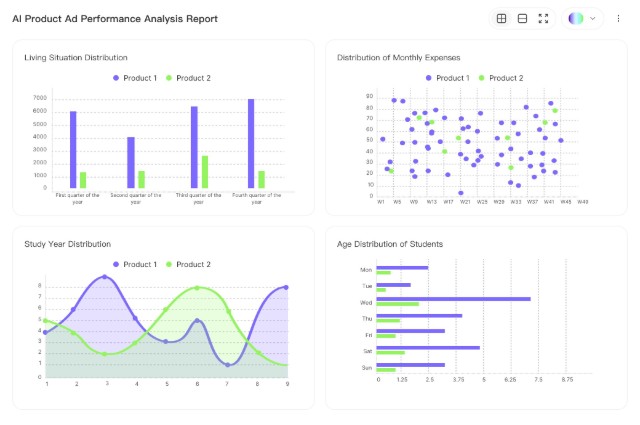
    Don't start from a blank page. Our Agent applies top-tier consulting frameworks to your data, identifying trends, pinpointing anomalies, and drafting high-level Executive Summaries with rigorous logic.

Before / AfterFrom cluttered SQL tables to polished executive slides with a Key Insights callout.
Reasoning EngineAuto-Frameworking
Consultant-Grade Automation preview
CORE VALUE PILLAR 2

The Intuitive Professional Editor

  • AI-driven speed, human-refined soul.

    Let the AI draft, then you direct. Our built-in editor is designed specifically for data storytelling. Change the narrative tone, adjust brand styling, or command the Agent to "swap this bar chart for a cohort analysis" via simple chat.

Refine with CommandHighlight a paragraph and instruct: "Agent, make this more persuasive for the CFO."
The Intuitive Professional Editor preview
CORE VALUE PILLAR 3

Live Dashboard Synergy

  • Presentation isn't the end of the journey.

    Static slides are for the past. With one click, your Agent generates a rich Live Dashboard that pairs with your presentation. During a meeting, click any insight to drill down into the live data source and answer "Why?" instantly.

Slide -> Live DashboardInteractive, 3D-style dashboard transition with real-time data pulses.
One-Click SyncDeep Drill-DownReal-time Q&A
Live Dashboard Synergy preview
CORE VALUE PILLAR 4

Autonomous Periodical Reporting

  • Your data never sleeps. Neither does your Agent.

    The ultimate cool factor. Our Agent does not just send reports on a timer; it autonomously monitors for deviations. It detects why your conversion dropped at 2 AM and has a detailed root-cause report waiting in your Slack or Inbox by 8 AM.

Notification Sequence08:00 AM: "15% spike in churn detected." Friday: "Weekly summary generated, key targets: 105% achieved."
Autonomous Periodical Reporting preview
02 // Bayeslab Advantage

Traditional vs. Bayeslab Storytelling

Replace fragmented reporting workflows with one agentic narrative system.

Workflow Phase
Bayeslab Storytelling
Traditional Tools

Synthesizing Insights

Manual observation (Hours)

Formatting & Design

Fighting with alignments/fonts

Data Updates

Re-screenshot, re-paste

Monitoring

Rigid thresholds, high noise

03 // How It Works

From Raw Data to Boardroom Narrative

A streamlined 4-step flow to go from fragmented data to executive-ready storytelling.

01

Connect

Link your SQL, Snowflake, or 50+ business apps in seconds.

02

Prompt

Tell your Agent the mission, for example: "Analyze why Q3 margins dipped."

03

Refine

Use the professional editor to polish the narrative and styling.

04

Present

Export to PPT or launch a Live Dashboard for interactive sessions.

04 // Ready to Impress Your Team?

Don't let great insights die in a spreadsheet.

Join the next generation of data-driven leaders. No credit card required.

AI-Powered Storytelling & Reporting - Bayeslab